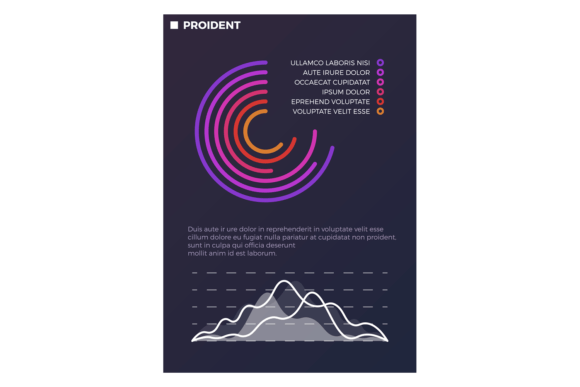
Unlocking Insights with Statistic Charts and Diagrams: The Power of Infographics
Statistic charts and diagrams, often presented as infographics, are powerful tools for visualizing data and making complex information more accessible. Whether you're a business owner, a professional, or a general consumer, understanding how to use these tools can significantly enhance your ability to communicate and make informed decisions.
Understanding Statistic Charts and Diagrams
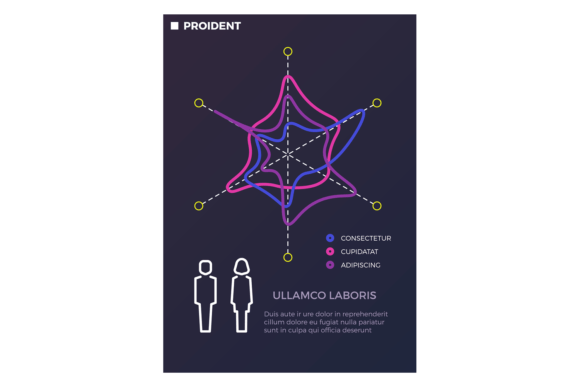
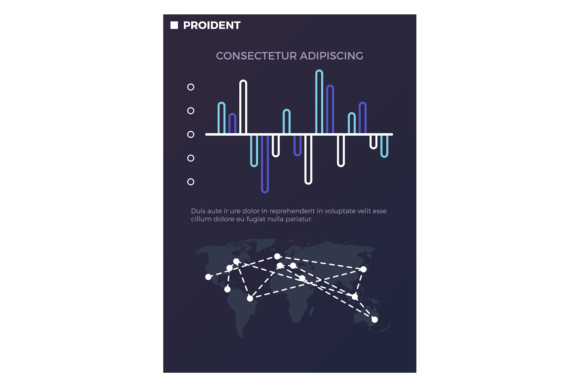
At their core, statistic charts and diagrams are graphical representations of data. They come in various forms, such as bar charts, line graphs, pie charts, and scatter plots, each designed to highlight different aspects of the data. These visual elements help in quickly grasping trends, patterns, and relationships that might be difficult to discern from raw numbers alone.
The Purpose and Features of Infographics
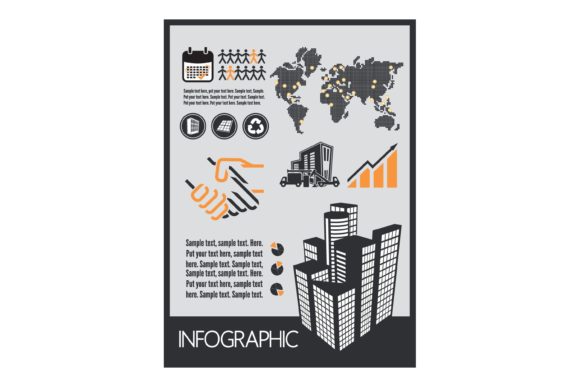
Infographics take the concept of statistic charts and diagrams a step further by integrating them into a visually appealing and cohesive design. The primary purpose of an infographic is to:
- Simplify complex information: Break down intricate data into digestible, easy-to-understand visuals.
- Engage the audience: Use color, icons, and creative layouts to capture and maintain the viewer's interest.
- Tell a story: Present data in a narrative format, guiding the viewer through a logical flow of information.
Key features of effective infographics include:
- Clarity: Clear and concise labels, legends, and axes.
- Consistency: Uniform design elements, such as color schemes and font styles.
- Relevance: Focused content that directly supports the intended message.
Where and Who Can Benefit from Infographics
Infographics are versatile and can be used in a wide range of contexts. Here are some examples:
- Business Reports: Summarize financial data, market trends, and performance metrics.
- Educational Materials: Illustrate concepts in textbooks, presentations, and online courses.
- Marketing Campaigns: Highlight product features, customer testimonials, and industry statistics.
- News and Media: Present survey results, election outcomes, and public opinion polls.
Professionals, creators, and business owners can all benefit from using infographics. For instance, a marketing manager might use an infographic to showcase the effectiveness of a recent campaign, while a teacher could use one to explain a scientific process to students.
Strengths and Considerations
While infographics offer many advantages, it's important to consider their strengths and limitations:
Strengths
- Enhanced Understanding: Visuals can make abstract concepts more concrete and easier to understand.
- Memorability: People are more likely to remember information presented in a visually engaging way.
- Shareability: Well-designed infographics are often shared on social media, increasing reach and engagement.
Considerations
- Data Accuracy: Ensure the data used is reliable and up-to-date to avoid misleading the audience.
- Design Quality: Poorly designed infographics can confuse rather than clarify. Invest in good design principles.
- Accessibility: Make sure the infographic is accessible to all users, including those with visual impairments.
Real-World Scenarios and Applications
Let's look at some real-world scenarios where infographics have been effectively used:
- Healthcare: An infographic explaining the benefits of a new vaccine, with clear visual comparisons of its efficacy compared to existing vaccines.
- Technology: A tech company using an infographic to break down the components and features of a new smartphone model.
- Environmental Awareness: An infographic highlighting the impact of plastic waste on marine life, with statistics and visual representations of the problem.
Evaluating Suitability for Your Needs
When deciding whether to use an infographic, consider the following:
- Audience: Who is the target audience, and what is their level of familiarity with the topic?
- Purpose: What is the main goal of the infographic? Is it to inform, persuade, or entertain?
- Data Availability: Do you have the necessary data to create a meaningful and accurate infographic?
- Resources: Do you have the design skills or budget to create a high-quality infographic?
By carefully considering these factors, you can determine whether an infographic is the right tool for your communication needs.
Conclusion
Statistic charts and diagrams, when presented as infographics, offer a powerful and engaging way to communicate complex information. By understanding their purpose, features, and best practices, you can leverage these tools to enhance your presentations, reports, and other forms of communication. Whether you're a business owner, a professional, or a general consumer, infographics can help you convey your message more effectively and make a lasting impact.