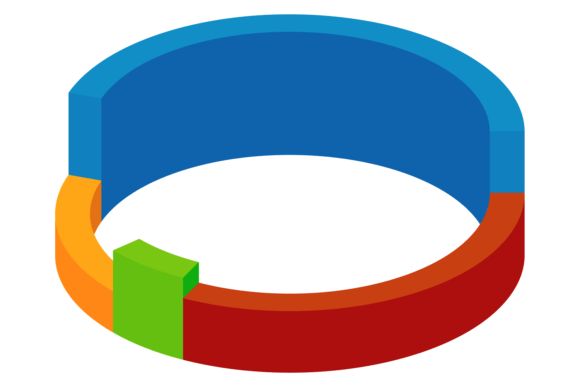
Using Ring Diagrams and 3D Isometric Infographics for Strategic Communication
The modern professional landscape is saturated with information. Entrepreneurs, marketers, educators, and decision-makers constantly face the challenge of distilling complex ideas, data hierarchies, and strategic plans into formats that are both comprehensible and compelling. In this context, the thoughtful application of visual tools like the ring diagram and the 3D isometric infographic becomes a strategic advantage, not merely a stylistic choice. These are not just graphics; they are frameworks for thinking and communication.
Understanding the Tools: Structure and Dimension
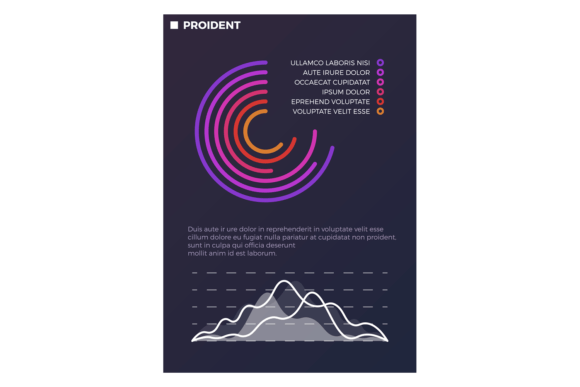
A ring diagram, often circular and layered, is fundamentally a tool for showing relationships, priorities, and cyclical processes. Its concentric rings can represent levels of importance, stages in a lifecycle, or the hierarchy of components within a system. When you see a ring diagram, you are inherently looking at a structure that suggests core elements, supporting layers, and often, an interconnected whole.
The 3D isometric infographic adds a critical dimension: perspective and spatial relationship. Isometric projection creates a three-dimensional effect on a two-dimensional plane, allowing viewers to perceive depth, arrangement, and the relative positioning of elements. This is invaluable for illustrating workflows, architectural plans of a project, or the stacked layers of a service offering. When combined, a color 3D isometric infographic element brings these structural and dimensional qualities into vivid focus, isolated for clarity against a simple background.
The Strategic Utility: Beyond Decoration
Why are these specific visuals strategically useful? They translate abstract strategy into concrete visual form. For a small business owner mapping out a new customer onboarding journey, a 3D isometric view can show the sequential "steps" a client ascends. For a marketer explaining a brand's core values (the inner ring) and their manifested expressions (the outer rings), a ring diagram provides immediate conceptual hierarchy. This visual translation serves multiple high-value purposes:
- Clarifying Internal Planning: Creating a ring diagram forces a team to define what truly belongs in the core and what is peripheral, a vital exercise in strategic focus.
- Enhancing External Communication: A well-designed color 3D isometric infographic can explain a complex product ecosystem or operational process to clients, investors, or new employees far faster than a text document.
- Stimulating Creative Problem-Solving: Viewing a challenge or a system spatially can reveal bottlenecks, overlooked connections, or opportunities for integration that a linear list might miss.
- Supporting Learning and Memory: The human brain retains visual-spatial information effectively. Using these graphics in training or educational materials can improve comprehension and recall.
The key is that the utility derives from intentional design, not from arbitrary use. The graphic must be constructed to reflect a genuine structure or relationship.
Intentional Application: Goals Before Graphics
Before searching for a stock ring diagram, color 3d isometric infographic file in EPS or PNG format, you must start with a strategic question. What are you trying to achieve? Are you mapping the decision-making layers in your company? Illustrating the phased rollout of a new initiative? Comparing the weight of different factors in a risk assessment? Your goal dictates the form.
- Define the Core Message: What is the single, central idea or entity? This belongs at the heart of your ring diagram or as the foundational block in your isometric view.
- Identify the Relationships: Are your elements supporting layers, sequential steps, or interconnected components? Rings suggest support and hierarchy; isometric stacks suggest sequence and building.
- Choose the Appropriate Dimension: If your concept is about progression through stages, the 3D isometric approach is powerful. If it's about the influence and reach of a central principle, the ring diagram is likely more suitable.
- Simplify Ruthlessly: The isolated, transparent PNG background exists to eliminate distraction. Your content within the graphic must undergo the same discipline. Too many rings or too many stacked elements will obscure, not reveal.
Practical Use Cases Grounded in Reality
Consider a freelance creator positioning their services. They could use a ring diagram where the inner ring is their primary creative skill (e.g., "Video Production"), the next ring is direct related services ("Editing," "Scriptwriting"), and an outer ring is ancillary offerings ("Equipment Consultancy"). This visually communicates specialization and breadth without conflating them.
A project manager planning a software launch might use a color 3D isometric infographic to show the project's "construction." The base layer is "Core Infrastructure," the middle layer is "Feature Modules," and the top layer is "User Interface & Testing." Each layer is color-coded and shown as a discrete, yet connected, level. This helps the team and stakeholders visualize dependencies and progress.
For an educator teaching a cyclical process like the water cycle or a business feedback loop, a ring diagram can beautifully illustrate the perpetual, interdependent stages. The isometric style, however, might be better for showing a linear historical timeline with concurrent events in different "tracks."
Planning and Execution Tips
Start your planning on paper or a whiteboard. Sketch the relationships first. Only then should you move to digital tools to create a polished version. Use color intentionally—to categorize, not just to decorate. Green for financial elements, blue for operational, etc. Ensure your final graphic, whether in SVG for web scalability or high-resolution JPG for print, maintains clarity when scaled down. The value is in its communicative power, not its aesthetic complexity.
The Risks of Misapplication
Using a ring diagram or 3D isometric infographic without clear goals or context carries significant risks. It can introduce confusion rather than clarity. A graphic that misrepresents relationships—for instance, showing sequential steps as concentric rings—will mislead your audience. Overcomplication is another common pitfall; a graphic stuffed with every minor detail becomes a puzzle to decode, defeating its purpose.
Furthermore, these visuals can inadvertently imply stability and fixed structure. If your process is agile and constantly evolving, a rigid, beautifully rendered isometric infographic might communicate an outdated, inflexible model. They are best used for communicating established frameworks, mature processes, or core strategic principles that are relatively stable.
Towards Long-Term Value and Better Results
The ultimate goal of employing these tools is to foster better decisions and achieve better results. A team aligned around a clear visual model of their strategic priorities (the ring diagram) makes more coherent choices. A client who understands your service structure through an isometric graphic develops more accurate expectations. The time invested in creating these thoughtful visuals pays dividends in reduced misunderstanding, accelerated onboarding, and sharper strategic focus.
Treat the ring diagram, color 3d isometric infographic not as a stock image to be dropped into a presentation, but as a strategic artifact to be crafted. It is a mirror for your thinking and a lens for your audience. By grounding its creation in your real-world goals, planning, and operational truth, you transform a generic visual element into a powerful instrument for communication and execution. The file format—EPS for professional editing, transparent PNG for flexible design integration—then serves the intentional master, not the random user.